GreenGen’s From the Experts series highlights insights from GreenGen professionals on emerging trends, challenges, and opportunities shaping real estate performance and value.
By:

Nigel Corea
Senior Program Analyst
Electricity is no longer a background assumption in real estate underwriting; it has become a direct driver of cost, timelines, and asset value. Investors who factor energy into their portfolio strategy today will have the advantage as grid constraints persist and the market continues to adjust. In addition, AI and electrification regulations/initiatives will significantly increase electric use in the near-term, which poses high risk to grid infrastructure that is struggling to keep up.
Grids in the US are under pressure, and the consequences are impacting project timelines, operating budgets, and property values. Investors who don’t pay attention to energy are not underwriting risk of an increasingly important part of their portfolios.
Here’s what’s driving the problem and what investors can do about it.
Why Grids are Struggling
Several trends are affecting electric infrastructure nationwide simultaneously.
- Data Centers and AI
The explosive growth of AI has triggered a massive surge in power demand. Data centers may account for nearly half of all new U.S. electricity demand through 2030. That load is concentrated in specific markets (Northern Virginia, Phoenix, Dallas, Columbus, Chicago) where it competes directly with commercial developers for capacity.
- Electrification
EVs, heating electrification, and electric appliances are all adding load to a system designed for a different era. U.S. electricity demand hit a record and is projected to keep climbing. Many jurisdictions are requiring electrification in commercial buildings as part of a larger effort to decarbonize the local environment, which increases strain on the grid.
- An Aging Grid
Roughly 70% of U.S. transmission lines are over 25 years old, with the majority being 50 to 75 years old. Transformers that once took 12 weeks to order now have lead times exceeding two years. The gap between what the grid can reliably deliver and what customers need is closing, and real estate owners are absorbing the consequences.
The Key Risk Factors Explained
- Rising Utility Rates
Energy costs are climbing fast, and for property owners with significant utility exposure, it’s becoming an NOI problem. The national average commercial electricity rate has risen 37% since 2020. In California, PG&E has projected rate increases approaching 50% through 2027, driven largely by wildfire mitigation investments. Commercial customers in the PJM (the electricity transmission network that supplies the mid-Atlantic) are facing total retail electricity rate increases of 15-30% over the next 24 months. Overall, owners that budgeted 3-5% annual utility increases are absorbing 10-15% (or higher) instead. While an owner’s cost burden depends on lease and billback structure, sustained rate increases can affect tenant economic health and retention, and property NOI.
- Grid Capacity

Source
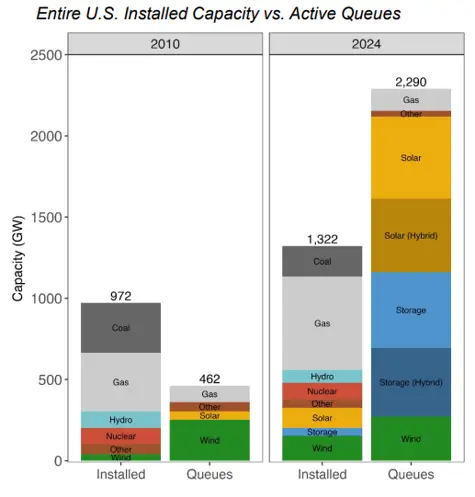
A project approved to break ground in 2026 may not receive full electrical service until 2028 if the local substation is already near capacity. Interconnection queues now represent over 2,000 gigawatts of waiting capacity nationally, more than the country’s entire installed power base. This can significantly delay new development timelines depending on the location substation’s capacity.
- Power Reliability
Climate-related events, such as extreme heat, winter storms, and wildfires, are stressing a system that wasn’t built for current demand levels. In 2021, Texas was subjected to rolling blackouts due to an ice storm that taxed its power grid and left more than 4.8 million customers without power and at least 246 people dead. simultaneously lost power when a single piece of equipment failed on a transmission line. Several grids nationwide are currently or will be subject to rolling blackouts in periods of high demand. This affects existing property values and insurance costs, as areas prone to outages carry higher business-interruption risk, while properties with backup power or on-site generation increasingly command a premium.
- Data Center Pressure
Data center concentration drives up local electricity prices and delays interconnection for all users. At the same time, markets with available power and proximity to digital hubs are attracting premium tenants and land values. PJM is encouraging utilities to push the cost of additional capacity back to the data centers as opposed to spreading rate increases over the whole customer base. While there is some recent success with easing the cost burden of data centers, property owners and tenants are already feeling the impact nationwide on their electric bills.
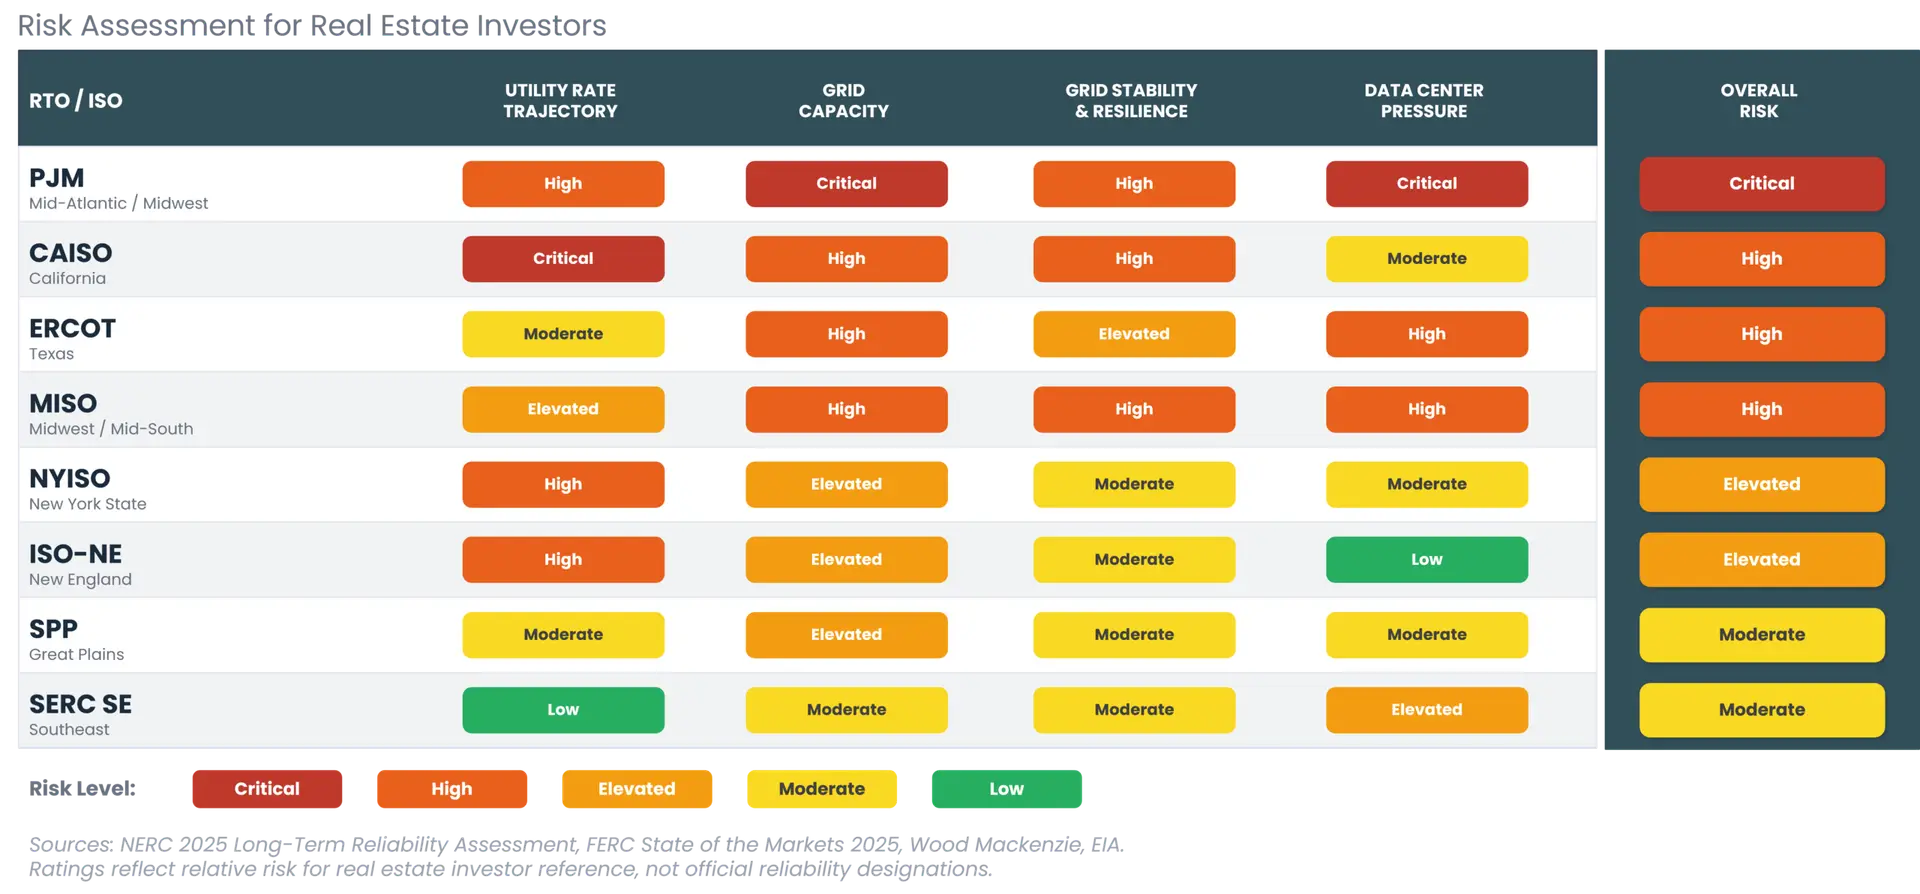
Regional Dynamics
Not all energy markets face the same risk profile. The table below rates each major grid region across the four key risk factors: utility rate trajectory, grid capacity, stability and resilience, and data center pressure.
RTO / ISO Grid Risk Matrix:
Regional Insights Shaping Risk:
- PJM
PJM is accelerating backstop reliability auctions to ensure adequate power is online while simultaneously pushing states to shield ordinary households from soaring costs driven by rapid data center growth.¹ - CAISO
A California appellate court upheld NEM 3.0 in March 2026, confirming the framework that cut rooftop solar export credits by roughly 75–80% compared to the prior net metering structure.² - ERCOT
Under Texas SB 6 (signed June 2025), ERCOT forecasts large loads on its grid growing from 87 GW today to 138 GW by 2030, while new large loads face mandatory curtailment equipment requirements.³ - MISO
NERC’s 2025 reliability assessment found that MISO is projected to face a 4,700 MW power shortage beginning in 2028, even accounting for 12,000 MW of planned new generation.⁴ - NYISO
A single proposed data center in upstate New York would draw power equivalent to roughly 16% of the total output of the Robert Moses Niagara Hydroelectric Power Station, illustrating how quickly upstate load is colliding with legacy hydropower capacity.⁵ - ISO-NE
Federal stop-work orders issued in late 2025 paused major offshore wind projects that ISO-NE had counted on for winter reliability, including Avangrid’s Vineyard Wind 1 off Massachusetts and a Dominion project off Virginia that was more than two-thirds complete and considered essential to military installations and Loudoun County data centers.⁶ - SPP
SPP’s board approved $8.6 billion in transmission projects, including some of the highest-voltage power lines in the United States, signaling that transmission — not generation — is the region’s primary bottleneck.⁷ - SERC SE
Georgia’s Public Service Commission approved rules in January 2025 requiring data center customers using more than 100 MW to enter long-term contracts ensuring they pay their fair share of grid costs, while Duke Energy adopted similar take-or-pay terms across the Carolinas.⁸
What Investors Can Do About It
The risk landscape is real but manageable. GreenGen recommends a range of strategies to reduce risk and exposure and turn energy into a competitive advantage.
- Market and Asset Risk and Prioritization
Investment strategy should consider market energy risk (the table above) in combination with physical climate risk, local regulations, and other relevant factors. Evaluate and prioritize markets based on level of risk exposure and projected impact on asset type or investment vehicle.
- Acquisition Due Diligence
Energy risk should now be part of pre-close due diligence. At minimum, GreenGen recommends that underwriting should address:
-
- Rate trajectory: What pending utility rate cases are active in this market? What is the realistic rate escalation over the hold period based on past performance and current market risk factors? Is the asset in a deregulated market?
-
- Reliability history: What outages has the property experienced? Is the property in an area subject to rolling blackouts? Is this risk expected to increase and how does the risk impact tenant, lease, or permission to operate requirements?
-
- On-site power: Is there solar, energy storage, or backup generation on the property? If not, is it technically and financially feasible to add? What incentives are available to support these projects?
-
- Lease structure: How do energy costs flow through to tenants? Does the structure incentivize investment in efficiency and generation?
-
- Market context: Is this market experiencing significant data center or electrification load growth that could delay projects, drive upgrade costs, or substantially increase strain on the grid?
- Long-Term Hold and Value Creation
For existing assets in the portfolio, the following strategies can be used to reduce the cost exposure from rising electricity rates.
-
- Energy Efficiency Measures
Engage an auditor, like GreenGen, to identify measures that can be implemented to reduce energy consumption with estimated capital costs, available rebates and incentives, annual savings (NOI impact), and the subsequent payback period.
- Energy Efficiency Measures
-
- On-site Solar PV / Battery Storage
Commercial solar can offset 30-80% of a building’s purchased electricity, replacing volatile utility costs with a predictable fixed-cost asset. At today’s rates, many commercial systems in solar-friendly markets reach payback in 7 to 8 years. The federal Investment Tax Credit (ITC) currently offers a 30-50% credit for commercial installations but is set to expire in December 2027 unless safe harbor is obtained by July 4, 2026. Battery systems reduce demand charges by discharging during a building’s peak 15-minute draw interval. Storage also provides backup power resilience for markets with reliability concerns. Several states and utilities also offer incentives and rebates for PV and battery storage.
- On-site Solar PV / Battery Storage
-
- Demand Response
Demand response programs pay energy users to reduce consumption during grid stress events. With smart building controls, participation requires little operational disruption while generating direct revenue. Availability varies by market and utility.
- Demand Response
-
- Power Purchase Agreements/Energy Procurement
A Power Purchase Agreement (PPA) enables a property owner to contract for electricity from an on-site or off-site renewable generator at a fixed price for 10 to 20 years, effectively hedging against utility rate escalation. In deregulated markets, multi-year supply contracts offer similar rate stability.
- Power Purchase Agreements/Energy Procurement
The Bottom Line
The grid challenges described are not temporary. Load growth, aging infrastructure, and interconnection backlogs all point to a gap between electricity supply and demand that will take years to close. Real estate investors who engage with energy risk proactively, through diligence, on-site generation, demand management, and smart procurement, are better positioned to drive and protect asset and portfolio value than those who still treat power as a given.